Franklin India Income Opportunities Fund (FIIOF) is a debt fund in the nature of Credit Opportunities Fund. Such funds mainly invest in long term corporate debt with returns depending on the prevailing interest rates in the economy. Such funds do not invest in Government securities which give a risk-free return, instead investing in corporate debt which can give higher returns. The return is dependent on the risk taken which is reflected (to some extent) by the credit rating of the instruments invested in. Usually lower rated instruments would give higher returns for the fund, but they carry higher risk - of default. Given the limited upside that debt instruments and by extension debt funds offer, there is limited tolerance for even a single default. Thus such funds have to balance between returns higher than peers and avoiding default risk. This they do by investing in instruments below AAA (highest credit rating). The ratings are those assigned by external credit rating agencies (ICRA, Crisil, India Ratings, Care, Brickworks). Nevertheless the fund house does its own research and analysis of the credit strength of the instrument it invests in. Again, returns of such funds will be range bound (+/- 2% of the median) but default downside cannot be accurately captured because it depends a lot on the understanding of the credit risk of the instrument, which is an inexact science, more so in India. There have been instances of highly rated companies defaulting in the past few years.
Coming to FIIOF, I picked this because I was astonished by the portfolio. The fund has a long history (launched in December 2009) and is rated highly amongst the peers on a research site, which reflects the returns generated over a particular time period. Further the Assets Under Management (AUM) of the company are healthy at ~Rs. 3000 crore.
For Direct Plan
|
Annualised Return (%)
|
1 year
|
11.5
|
2 year
|
9.9
|
3 year
|
10.5
|
The problem though is the portfolio which I have analysed in 7 graphs -
Graph 1 - Split of Portfolio
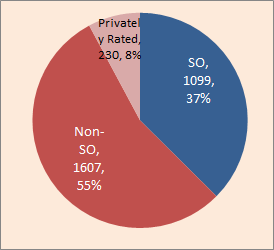 First up, we look at the portfolio split in terms of ratings which are SO (Structured Obligation) and those which are not. SO is a common parlance in rating industry and means rating which derives comfort or support from some structural feature of the instrument that is rated. This structural feature gives an uplift to the standalone rating of the issuer. Now what constitutes a structural feature which strengthens a rating is an interpretation which varies from one rating agency to another. For instance, an explicit and strongly worded guarantee to service the debt being rated can be a strong structural feature.
But SO ratings may also be a way for a rating agency to take refuge behind structural features, all of which are not materially and practically strong, to assign a higher rating than what an issuer deserves on its individual merit. Looked in another manner, companies may try to add structural features (genuine or dubious) to a debt instrument to get an uplift to its ‘base’ rating. In conclusion an SO rating may or may not actually carry the strength of the rating symbol assigned. Thus high proportion of SO ratings in the fund portfolio can be a sign of risk, or a case of back-door entry into a fund.
Graph 2: Rating Agency-wise portfolio split (value in Rs. Cr.)

In India there are five rating agencies of some stature (there are more, but small as of now). These rating agencies can be ranked in terms of their rating quality, market acceptance, market share and standards of due diligence, which I would not go into here. For this fund, 50% of the portfolio is rated by Brickworks (BWR), the newest rating agency, and Care Ratings. Also, BWR’s ratings are also almost entirely SO which may point to the eagerness of the rating agency to assign higher ratings and the fund looking at higher ratings so as to meet its investment mandate. Crisil has no SO ratings in this fund and ICRA has only 23% of SO ratings (by value).
Graph 3: Ratings-wise portfolio split (value in Rs. Cr.)
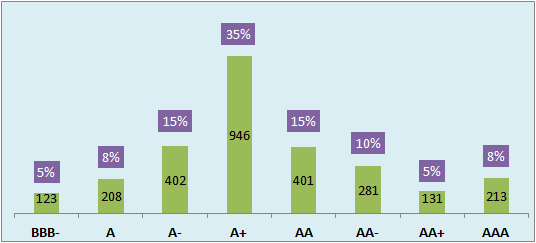
A rating is an indicator of investment’s relative safety, so higher rating means lesser probability of default and vice versa. As a corollary, higher ratings would fetch lower return to a fund as against a lower rating. A fund has to balance between safety and returns. But as per me, safety should have higher weightage in a debt fund given that the return upside from a lower rated instruments may not justify the downside of a staggering default. Inherently, this also shows lack of market depth and inadequate understanding and pricing of the credit risk. Nevertheless, debt mutual funds do not go too low down the rating scale in search of higher returns. They tend to hover in the AA categories (each rating category has a 3 sub ratings, apart from AAA). As per a media article, at the end of May, credit opportunities funds had allocated 21% of their portfolio to paper rated AAA, 47% to AA category, 25% to A category and below, and the rest to cash or unrated bonds. Coming to FIIOF - 8% of portfolio is in instruments rated AAA, 30% in instruments rated in AA category, and a high 58% in instruments in the A category. In conclusion, the inherent riskiness of the portfolio, as communicated by the ratings is relatively higher.
Graph 4 & 5: Group-wise exposure of the fund (value)
 An interesting study of the portfolio is the exposure into entities of various business groups in the country. Surprisingly, the fund is invested heavily in instruments of entities belonging to a few groups and thus carries high concentration risk. Keeping aside investments into Banking & Financial sector (23% by value), which is relatively safer compared to corporate entities, and to non-Group or standalone exposures (21%), the remaining 54% of the portfolio is invested in just 6 groups (caveat: Jindal Group refers to entities in the OP Jindal Group, although they operate as separate groups). And some of these groups are not in the best of financial health, details of which I would not go into here. Just to drive home the point of strength of the group and tendency to piggyback the relative weak credit on SO (as explained earlier), the Group-wise SO exposure in FIIOF is presented below.
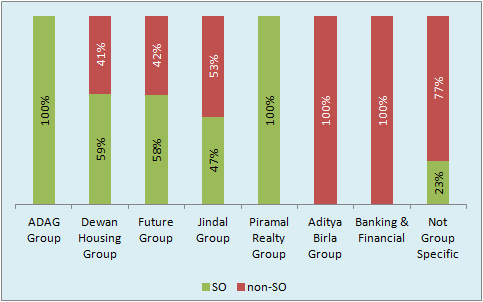
Graph 6: Basis of SO ratings (value % of total SO rated value)
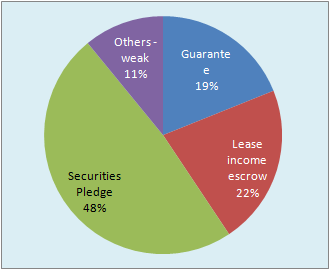
Continuing with my concern with SO ratings, I have drilled down the factors on the basis of which SO rating was given in case of FIIOF. As mentioned, SO rating is derived from some structural feature which can have many forms. And it is a rating agency’s interpretation as to which feature is strong enough for it to be a ‘credit enhancement’ from its standalone basis. This interpretational aspect allows for weaker features to be used to append SO. Assessing strength and weakness of a structural feature is a credit rating skill which I would not go into. Yet, for FIIOF, many SO ratings are based on relatively weaker structural features.
Graph 7: Risk assessment - personal view
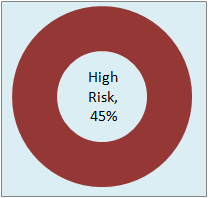 I close this blog with my assessment of what I think are riskier investments of this portfolio. Degree of risk is a relative assessment and based on context. What constitutes ‘high’ risk in mutual fund industry may not be so within the rating industry definitions. Or what is risky to one fund manager may not be so for another. This difference of opinion is what drives any market - more so the investment markets. So this analysis of ‘high risk’ securities is entirely personal, and derives partly from Group Exposures and the ratings.
Is the entire info used in your analysis available in the public domain?
ReplyDeleteYes - moneycontrol for portfolio details and rating rationales from the rating agencies websites
Delete